
Kaushal Chaudhary
Market Analyst | Macro, FX & Commodities
I analyze spot gold and major FX around the London/New York overlap, combining macro event framing with custom software tooling. Every session starts with a written plan defining directional bias, invalidation levels, and fixed risk. Every session ends with a structured error-class review.
Because I am also a software developer, I build the tools (Python, SQL, Excel, React/Next.js) to log, visualize, and audit the process—turning market views and execution data into clean tools a research or trading desk can actually use.
About Me
A documented macro process, disciplined execution, and practical desk tooling.
My name is Kaushal Chaudhary. I am a software developer and independent trader based in Bengaluru, working at the intersection of financial markets and web engineering.
For the past year, I have worked professionally as a frontend developer building production applications with React, Next.js, and TypeScript. Alongside my software career, I have spent the last three years actively trading and analyzing spot gold (XAU/USD) and major FX.
I am not claiming institutional bank experience. What I bring is three years of screen time, strict risk discipline, and the mindset of an engineer applied to the markets: I do not like guessing, I write down my trade plan and invalidation level before taking risk, and I audit my execution mistakes afterward so I do not repeat them.
How I work
In both trading and software, I am process-driven and comfortable being wrong, as long as my risk is capped and I know why I was wrong. I care more about following the rules and finding the bug in my execution than looking smart. I work best in fast-paced environments where risk limits are strict, feedback is direct, and performance is measured by data rather than ego.
What I am looking for
I am targeting Discretionary or Execution Trader, Trading Desk Support, Market Research, or FinTech Analytics roles. I want to join a trading firm, prop desk, or research team where real screen experience in gold and FX—combined with the ability to build custom software tools—is useful from day one. Because my background is non-traditional, I do not expect you to take my resume on faith. Give me a market scenario, an execution test, or a data task, and let me prove how I work.
Market & Analytical Skills
Process, platforms, and analysis tools I use to plan, review, and communicate market work.
My Experience
A snapshot of my professional journey, highlighting key roles and achievements.
Independent Market Analyst & Trader
- Macro & Session Planning: Write daily pre-session plans for spot gold and major FX during the London/NY overlap, establishing directional bias, hard invalidation levels, and fixed position sizing prior to execution.
- • Rates & Event-Risk Framing: Track CPI, FOMC, and NFP releases against DXY and US Treasury yields (2Y/10Y) to filter rate-path repricing from market noise and make structured trade vs. stand-aside calls.
- • Risk & Error Auditing: Enforce pre-entry hard stops and a strict no-adding-into-prints rule. Conduct weekly audits categorizing execution into specific error classes (late entry, skipped invalidation, news-spike sizing) to systematically correct behavioral leaks.
- • Tooling & Data Analytics: Maintain an auditable trade journal and build supporting analytics workflows using Python, SQL, Excel, and modern web frameworks to track performance metrics and visualize macro event outcomes.
SDE Intern (Frontend)
- Designed and implemented an internal NDR (Non-Delivery Report) calling interface supporting single and bulk operations, improving task efficiency by 25% through workflow consolidation and reduced UI transitions.
- Refactored onboarding flows into modular, reusable components, decreasing code duplication by 40% and enhancing long-term maintainability.
- Diagnosed and resolved UI and API integration issues across OMS modules, reducing recurring production bugs by 20-25% and improving overall system stability.
Frontend Developer
- Built a high-performance Next.js e-commerce platform with SSR, optimized images, and caching, improving page load speed by 30%.
- Integrated Strapi Headless CMS for blog and product management, enabling non-technical teams to publish content 50% faster.
- Developed scalable UI components using React, Tailwind CSS, and reusable layouts, reducing frontend development time by 35%.
- Executed SEO optimization across 3 websites, achieving a 100 SEO score on Ahrefs and 95+ across other performance metrics.
- Implemented structured data, sitemaps, and meta-tag automation, increasing organic traffic by 40% and improving keyword rankings.
Frontend Developer
- Delivered 10+ responsive React.js web applications, improving user engagement by 35% and session duration by 20% through optimized UI/UX and component design.
- Optimized performance using React hooks, lazy loading, and code-splitting, reducing load time by 25% and improving performance scores by 20%.
- Built reusable UI components with Tailwind CSS, reducing development time by 40% and ensuring consistent design across devices.
- Conducted SEO audits using Ahrefs and Google PageSpeed Insights, improving SEO scores by 25% and increasing organic visibility by 30%.
- Ensured cross-browser and mobile compatibility through responsive design optimizations, resulting in a 20% increase in mobile user traffic.
Selected Frontend & Analytics Projects
Two frontend builds and two analytics dashboards, showing product execution and data communication. These are not trading-performance records.
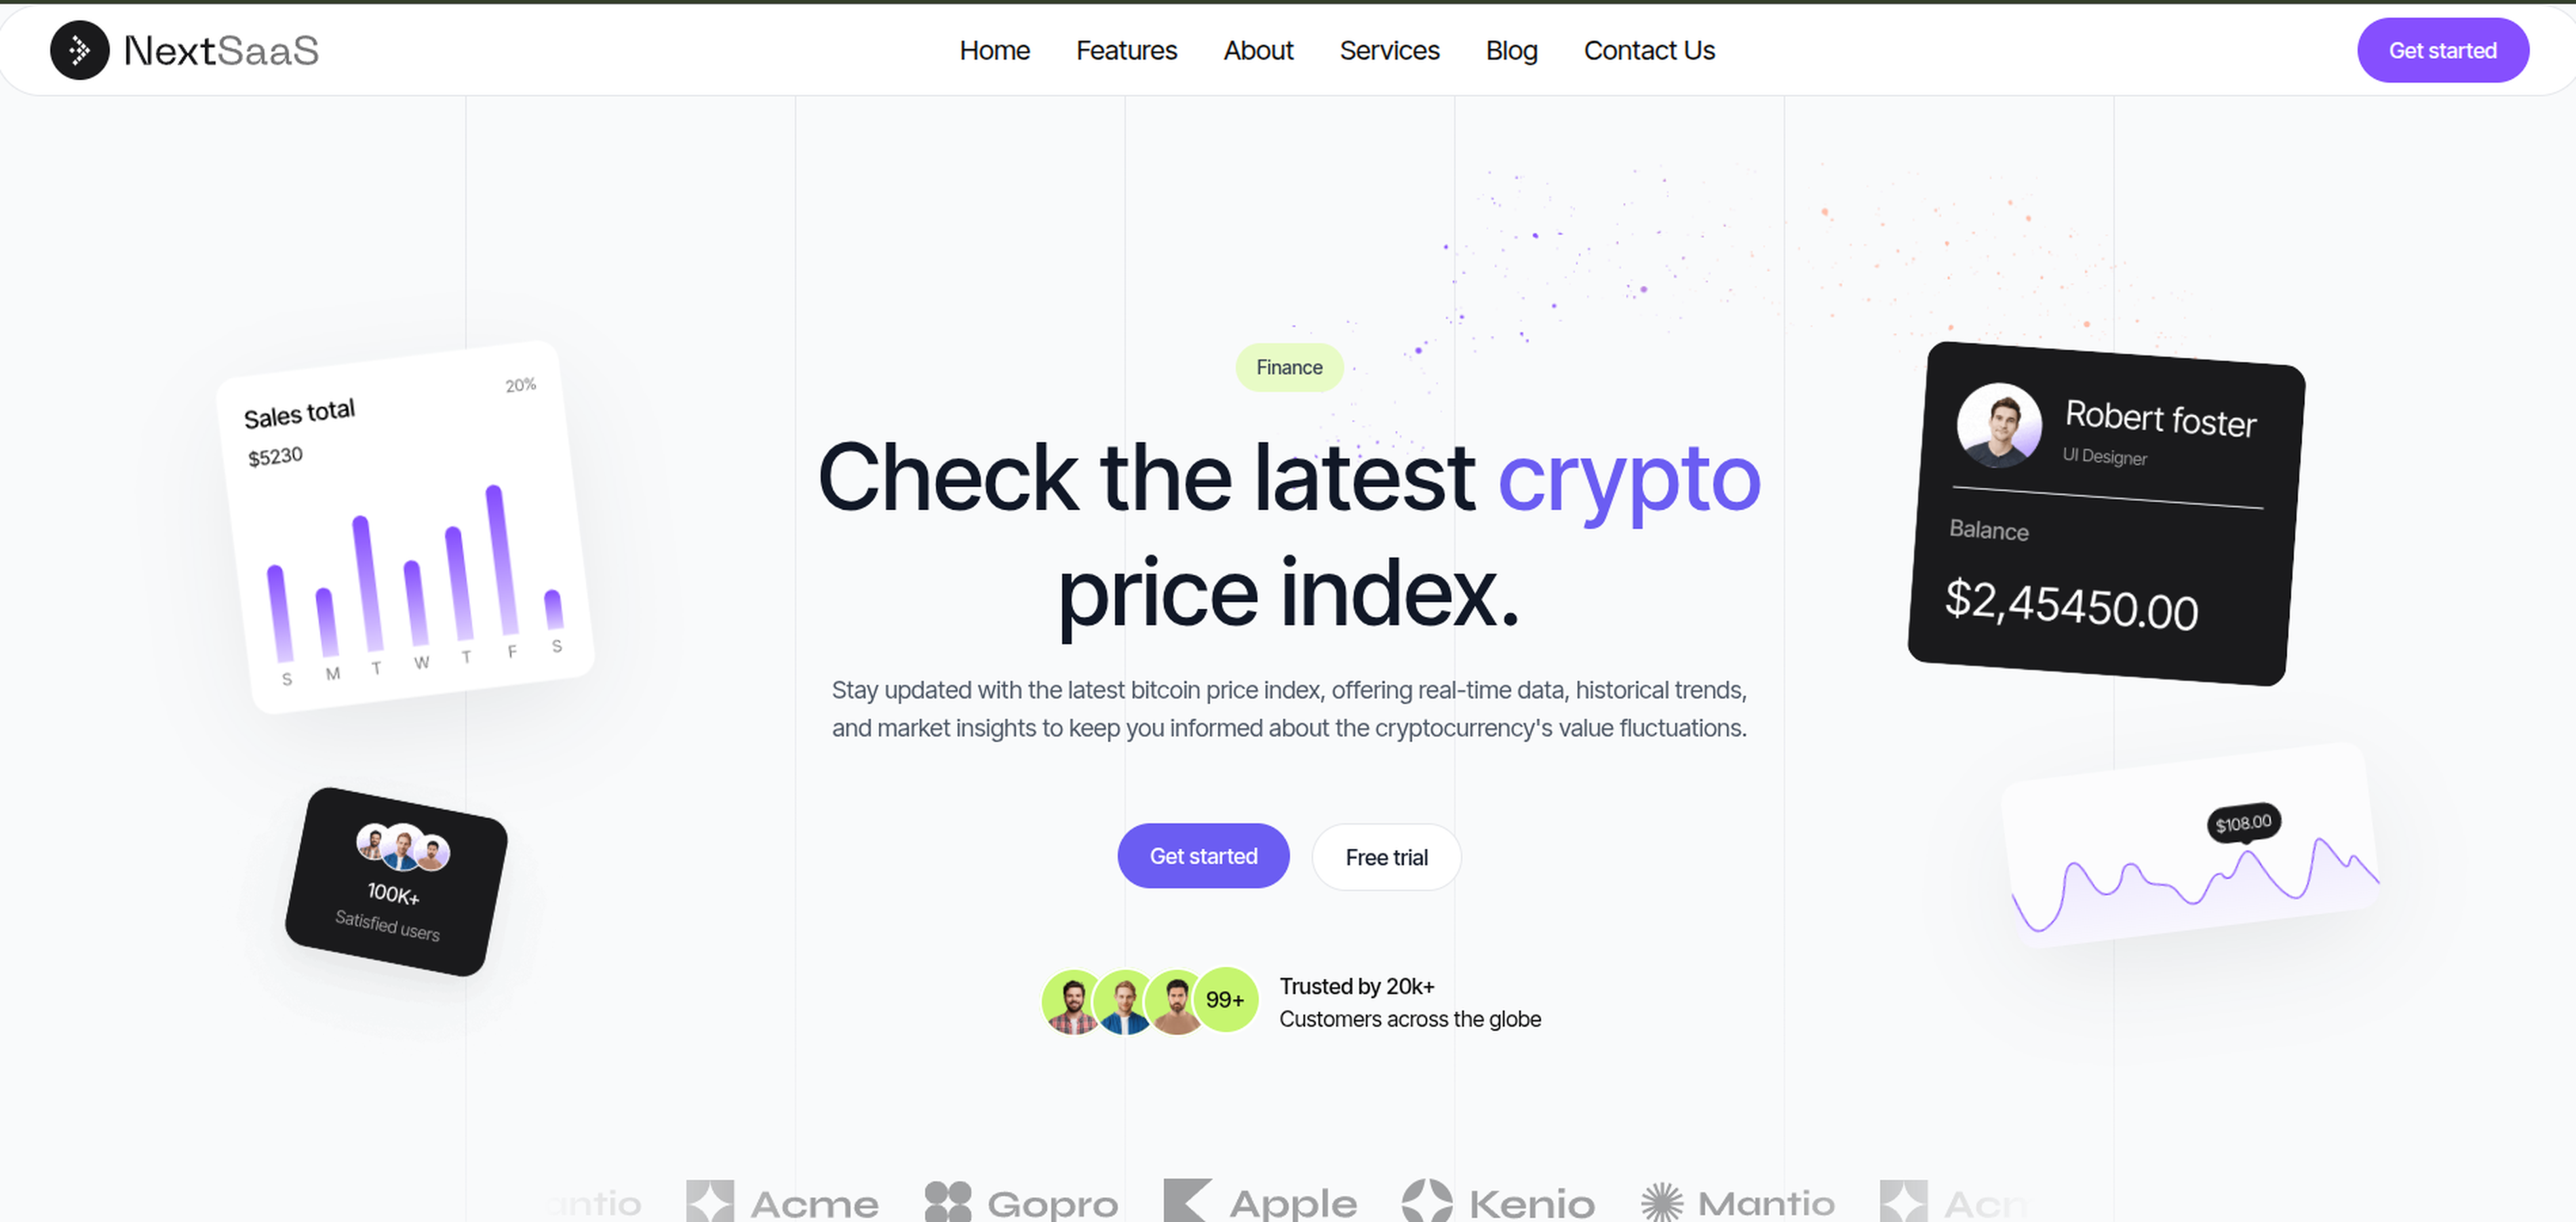
Frontend Engineering
SAAS Platform
Built a high-performance SaaS website using Next.js 14 and TypeScript, leveraging SSR, SEO best practices, metadata, Schema.org, Open Graph, and social cards to maximize performance and search visibility. Designed responsive, interactive UI with Tailwind CSS and Framer Motion, implementing smooth scrolling, scroll-based animations, reusable animation components, and efficient client-side state management.

Frontend Engineering
Art & Magazine
Built a reusable, component-driven architecture with centralized utilities, async data fetching, Suspense-based loading states, and dynamic metadata generation for SEO. Delivered a fully responsive, accessible UI with semantic HTML, mobile-first navigation, newsletter signup, social sharing, optimized image settings, canonical URLs, and cross-browser compatibility.
Data Analytics
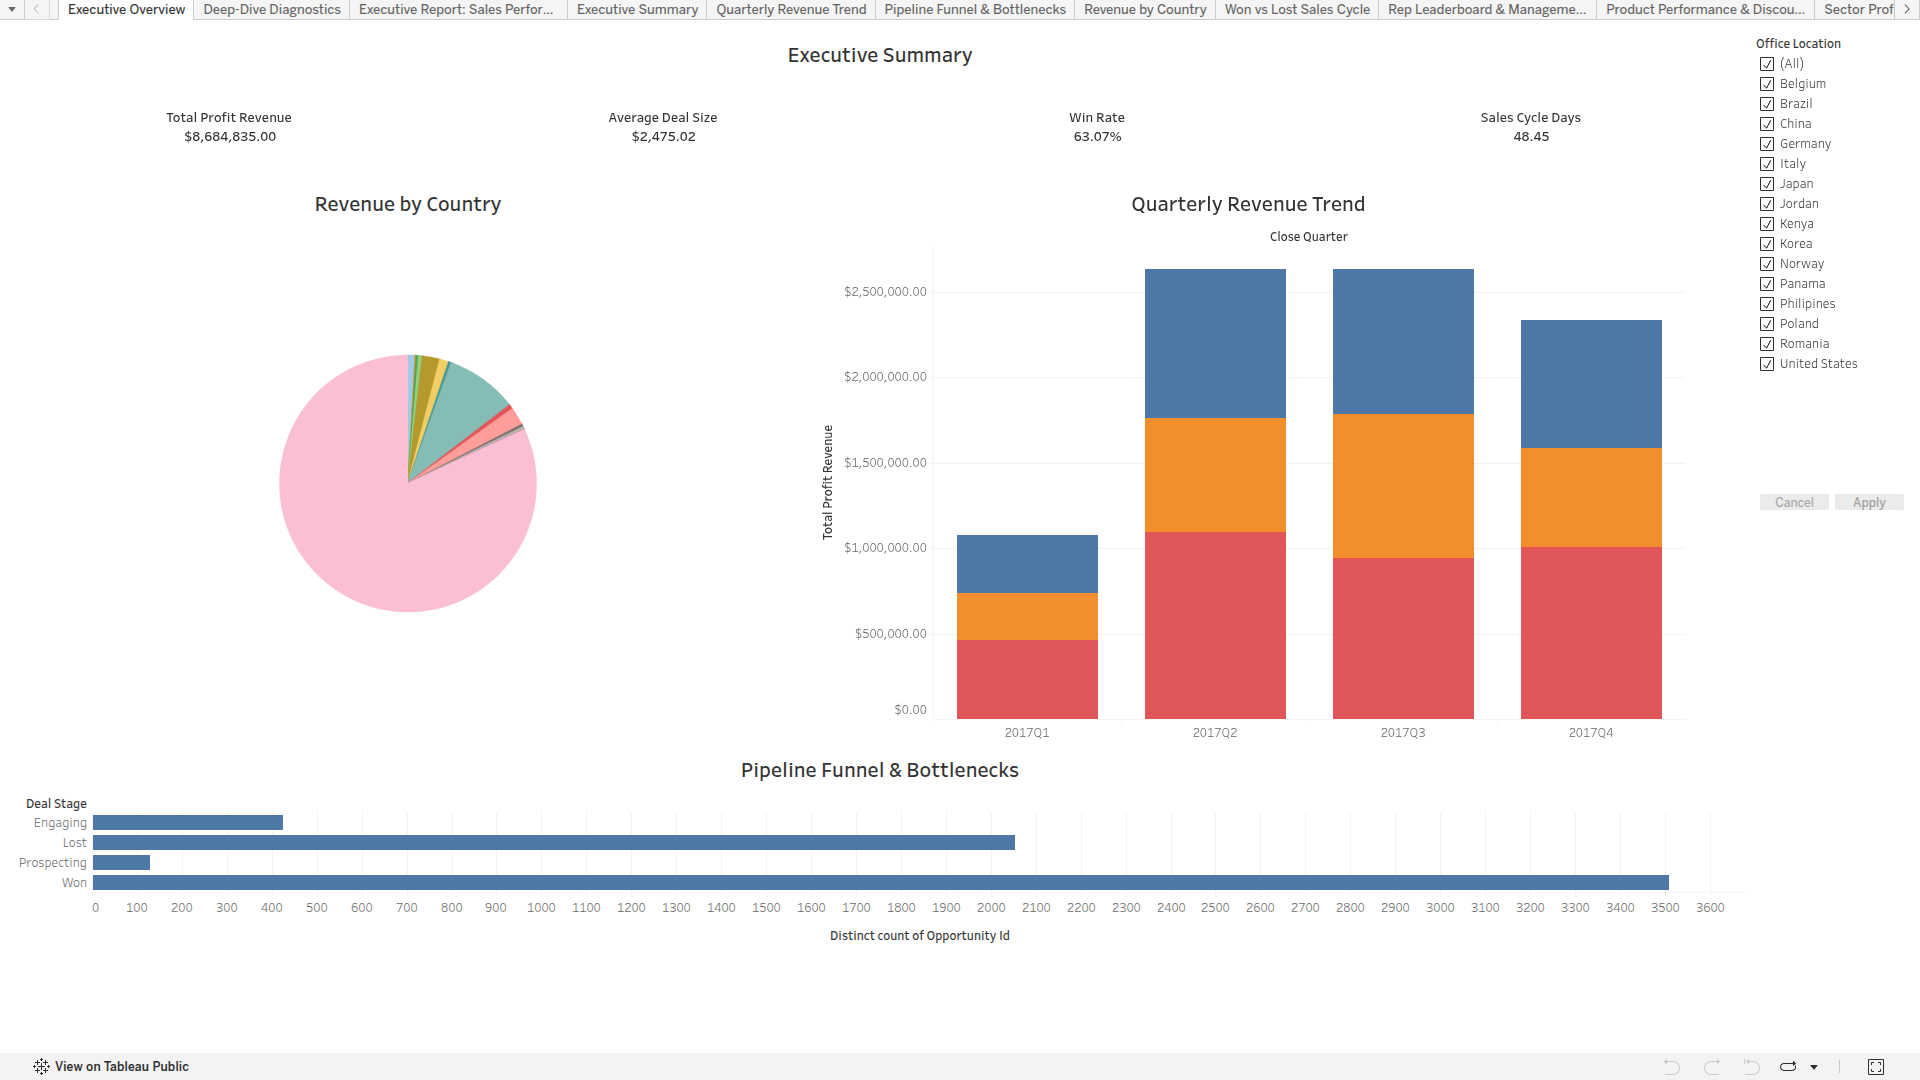
CRM Sales Pipeline & Performance Executive Dashboard
Analyzed enterprise CRM sales pipeline data ($8.68M total profit revenue) across accounts, products, and sales teams. Modeled deal win rates (63.07%), average deal sizes ($2,475), and sales cycle velocity (48.45 days). Interactive Tableau executive dashboard featuring regional office diagnostics, quarterly revenue trends, pipeline funnel bottleneck analysis, and product series revenue distributions.
Data Analytics
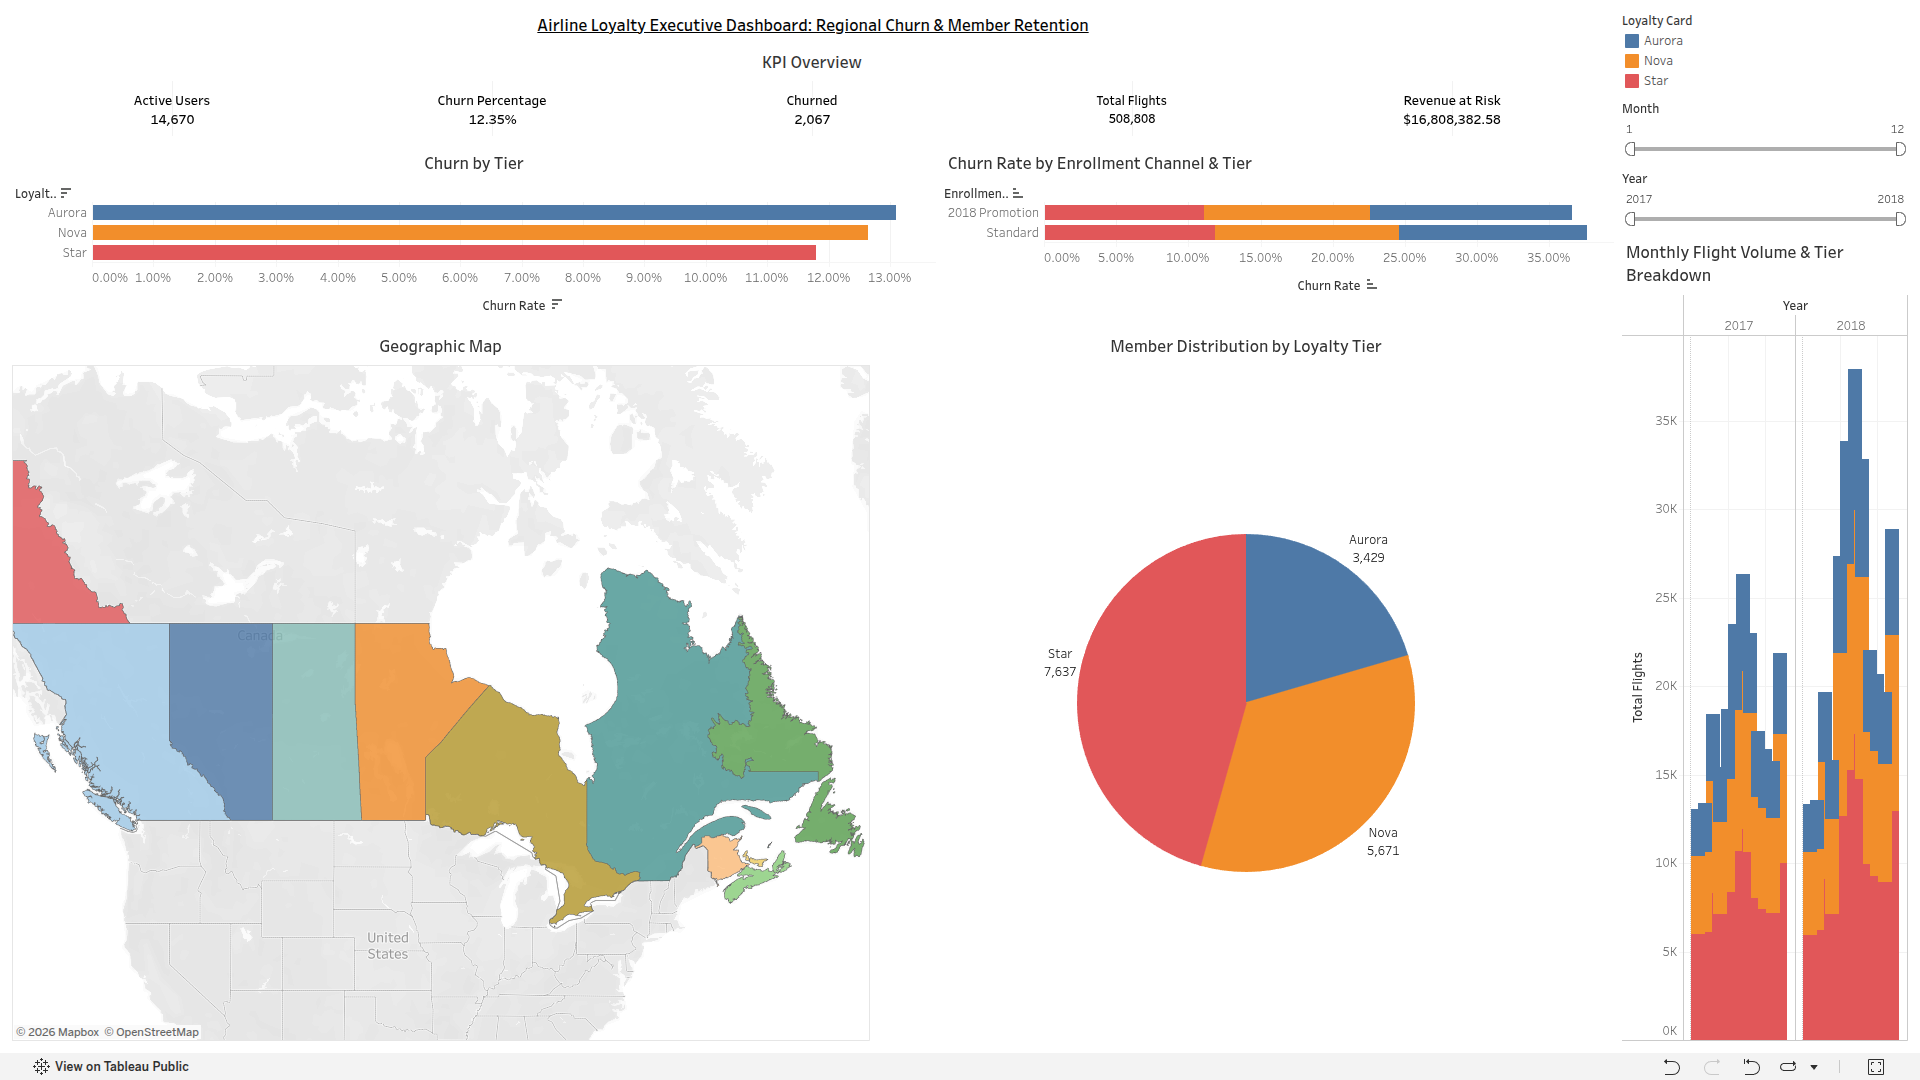
Airline Loyalty Executive Dashboard: Regional Churn & Member Retention
Engineered an executive retention model analyzing 16,737 customer profiles and 391,000+ flight transactions across Canada. Quantified $108.4M CLV revenue at risk and uncovered a 2.4x higher churn rate in promotional signups. Designed interactive Tableau executive dashboards displaying seasonal monthly flight volumes (2017-2018), geographic regional churn maps, and loyalty tier retention matrices.
Frequently Asked Questions
Get answers to common questions about my services and expertise
Market Analyst, Market Research Analyst, Trading Assistant / Execution Support, or FinTech Data Analytics. I am looking for an early-career seat where a structured macro process and the ability to build internal data tools add immediate value.
I view spot gold primarily through the lens of US real yields and the dollar. Around scheduled catalysts like CPI, FOMC, and NFP, I track DXY and the US 2Y/10Y yields to judge whether a release alters the rate path or just creates short-term noise. If the rate view isn't clear, the call is to stand aside.
Invalidation levels and hard stops are set before calculating position size. I never average down or add into high-impact news prints. Most importantly, I treat a skipped invalidation as a process failure in my weekly review, even if price eventually recovers and the trade makes money.
Yes. Early on, a recurring mistake was forming a clean pre-CPI gold bias, watching the initial spike invalidate my level, and fading the move because I was anchored to my original entry. With DXY still making highs, fading the move was hope, not analysis. Tagging that error class forced a strict rule: once invalidation hits during a print, either stand aside or wait to trade the continuation.
Research and trading desks spend too much time wrangling messy spreadsheets. I use Python, SQL, and Excel to structure trade journals, tag error classes, and analyze event-day behavior. Because I also build production web interfaces in React, Next.js, and TypeScript, I can turn raw desk data into clean internal dashboards for the team.
Yes. I keep my raw journal off the public internet, but I am happy to share my session plans, error-class audits, and tracking tools live in an interview. Better yet, give me a trial task—hand me a market event, a dataset, or a research prompt, and I will return a structured brief or dashboard within 48 hours.
No. This portfolio documents my analytical process and technical skills strictly for hiring and career purposes. Nothing on this site is financial or investment advice.
I am based in Bengaluru, India, and already work the London and New York overlap. I am open to on-site, hybrid, or remote roles across Indian and global market hours.
Get In Touch
Feel free to reach out to me through any of these platforms.